I've started a series of posts explaining why I prefer F# to VB.NET and C#. This is yet another post in that series. In this post, I hope to talk about the benefits of F# Interactive Mode.
To get F# Interactive, you can either install a recent version of
Visual Studio Pro (or higher) or you can follow the instructions
provided by the
F# Sharp Foundation
here.
(NOTE: You *should* be able to also install F# on GNU/Linux
following the appropriate instructions on the
F# Software Foundation website. At the time of this post, those
instructions were found
here)
For the purposes of this blog post, I will be using the third option that was mentioned on the web site: "Option 3: Install the F# compiler and tools alone"
This third option, which offers the possibility of using F#
independent of Visual Studio, can possibly support an argument that
F# *may* be able to serve as an replacement for
GNU Octave when
run in a suitable *.NET environment such as Windows 8 or
Mono.
(NOTE: I will not discuss installation of
F# in this post since the F# Software Foundation Website already
has excellent instructions)
After you follow the instructions from the F# Software Foundation
website to setup F# on your machine, you will probably find F#
in a directory path similar to this:
C:\Program Files (x86)\Microsoft SDKs\F#\3.0\Framework\v4.0
(NOTE: Your path and version information may vary slightly.)
If you open that directory in File Explorer, you will likely see executables named Fsc and Fsi among other files. The Fsc file is for the command line compiler and the Fsi file is for the interpreter. This post is not concerned with the compiler which can also be run from within a Visual Studio IDE. Instead, this post is interested in running F# in an interactive mode to emulate a Matlab/Octave like environment independent of Visual Studio.
You can double click on the Fsi Executable in the F# installation directory to be greeted with a prompt similar to this:
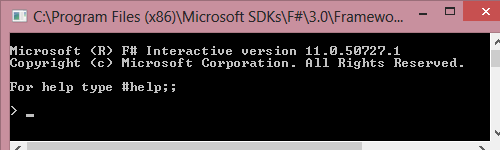
(FSharp Interactive Command Prompt)
Now, suppose you were a *high tech* hillbilly of the EOA variety with plenty of land/wood sensibly raising a family in the middle of the Ozarks. You've played M.U.L.E. with your kids for the 1,000,000,000,000th time and you want them to get a breath of the ever abundant Ozark fresh air. You bust out your Win8 device to order the plans for a monster play set from some place in Europe only to find that all of the measurements are in metric. You realize that your PhD neighbors could translate all of these measurements to English in their head, but they aren't available right now because they are gone to Fayetteville giving a guest lecture at University of Arkansas
Looking for a quick easy way to do the translations, you install the FSharp interactive environment on your Win8 device and enter a simple approximation command like this [1]:
> let metersToFeet = m = 3.28 * m;;
Then to convert meters to feet that could be read on an American tape measure, you would simply run commands like this:
   > metersToFeet 1.0;;
   > metersToFeet 1.5;;
F# will then convert 1.0 meters and 1.5 meters into feet for you. Also, for quick recollection of a previous command, you can simply press the up arrow in the FSI Command Window. You can then adjust the meters passed into the command to the value of the board or object you currently need to cut/measure. Finally, to make sure you don't do something goofy like pass inches into the meetersToFeet function, you can also use F#'s feature called Units of Measure but that is the topic of another post.
Of course when you run the above commands, the outputs of 3.281 ft and 4.9215 ft aren't particularly friendly for use with an American tape measure, so you *might* define yet another function called friendlyFeet as so:
   > let inchesPerFoot = 12.0;;

   val inchesPerFoot : float = 12.0

   > let friendlyFeet f =
   -    let baseFeet = floor f;
   -    let totalInches = f * inchesPerFoot;
   -    let baseInches = baseFeet * inchesPerFoot;
   -    let remainingInches = totalInches - baseInches;
   -    baseFeet.ToString() + " ft " +
   -    remainingInches.ToString() + " inches";;
Then, when you want to convert meters to something that is easy to read, you can just do this in your interactive command window:
> friendlyFeet (metersToFeet 1.0);;
And you will get output like this:
> val it : string "3 ft 3.372 inches";;
You can also write the trivial function metersToFriendlyFeet on the fly:
> val metersToFriendlyFeet m = friendlyFeet (metersToFeet m);;
You might find it a bit cumbersome to press the up arrow and change the meters passed into metersToFriendlyFeet *every* time you want to convert a value to inches. If so, you can use F#'s handy map function like this:
   > val metersToConvert = [1.0; 1.5; 1.2; 1.61];;

   val metersToConvert : float list = [1.0; 1.5; 1.2; 1.61]

   > let convertedVals =
   >    metersToConvert |> List.map metersToFriendlyFeet;;
The F# Interactive Command Window will then spit out a list of the converted values back to you in a friendly ft and inches format.
Or, if you rather, you can even use F# Interactive to create WebForms that will process and display your data. Check out Don Syme's post at [2].
You may be thinking that that is an awful lot of typing to have to go through each time you want to convert Meters to Feet in the Interactive F# Window. Well, you have two options to resolve that. You can either use the F# Compilers and environments to compile your scripts into a module or you can save your scripts to an FSharp Script (.fsx) file and reload them at a later time. The later option is the easiest, so I will cover it.
To save your scripts for later use, you would bust open Notepad and type in the following:
   module conversions
      let metersToFeet m = 3.28 * m
      let inchesPerFoot = 12.0
      let friendlyFeet f =
         let baseFeet = floor f
         let totalInches = f * inchesPerFoot
         let baseInches = baseFeet * inchesPerFoot
         let remainingInches = totalInches - baseInches
         baseFeet.ToString() + " ft " +
         remainingInches.ToString() + " inches";
You would then save the file to something like "d:\conversions.fsx"
The next time you start F# Interactive, you would simply run commands like this to load your script:
   > #load "d:\myConversions.fsx";;

   [Loading d:\myConversions.fsx]

   namespace FSI_0002
     val metersToFeet : m:float -> float
     val inchesPerFoot : float
     val friendlyFeet : f:float -> string


   > open conversions;;
Then, once your script was loaded, you would continue to call friendlyFeet and the other functions as usual.
Now, suppose you were helping your daughter with beginning algebra
and you wanted to help her visualize the intersection of two lines.
You might start out by defining two functions like so:
let f1 x = 2.0 * x + 10.0;;
let f2 x = 4.0 * x;;
The two above F# Function definitions correspond to:
y = 2x + 10
and
y = 4x
Don't be confused by the "let f1 x =" and "let f2 x =" portions of the above equations. "let" is just a reserved to let F# know that a definition is coming and "f1" and "f2" are just names for those definitions. Also, definition names have to be unique in F# (as well as *most* programming languages), so we can't just use the name "y" like we would in algebra.
The next thing you would want to do is to plot these two functions. Fortunately, F# makes this reasonably easy as you can see in Mr. Hugard's post at [3].
With some minor changes to Mr. Hugard's code at [3] and help from Tomas Petricek [4] we can come up with a "Form" type in an fsx file that will allow us to plot multiple functions:
(* This code is based off of a Stack Overflow post by
   James Hugard @
   http://stackoverflow.com/questions/3276357/how-do-i-plot-a-data-series-in-f

   Other References:
   Tomas Petricek @
   http://stackoverflow.com/questions/16783196/f-interactive-pass-paramarray-of-functions
   *)
module HuggardPlot

#r "System.Windows.Forms.DataVisualization"
open System
open System.Windows.Forms
open System.Windows.Forms.DataVisualization.Charting

type LineChartForm(
                    title,
                    minX,
                    maxX,
                    [] funcs: (float -> float)[]) =
   inherit Form( Text=title )

   let chart = new Chart(Dock=DockStyle.Fill)
   let area = new ChartArea(Name="Area1")

   do for func in funcs do
      (* Add the first plot Hugard style *)
      let series = new Series()
      do series.ChartType <- SeriesChartType.Line
      do for i in minX .. maxX do
         series.Points.AddXY(i, func(i)) |> ignore
      do series.ChartArea <- "Area1"
      do chart.Series.Add( series )

   (* Add area1 to the plot *)
   do chart.ChartAreas.Add(area)
   do base.Controls.Add( chart )

(* Convenience method to make it easier to plot functions *)
let plotFunctions (minX, maxX, [] funcs: (float -> float)[]) =
   let LCF = new LineChartForm("lines", minX, maxX, funcs);
   LCF.Show();
After saving the above fsx file as d:\HuggardPlot.fsx, you can then run commands like the following in the F# Interactive Window to plot the two previously defined functions:
> #load "d:\HuggardPlot.fsx";;
[Some output from the F# Interactive Interpreter Goes Here ]
> open HuggardPlot;;
> plotFunctions (-8.0, 8.0, [|f1 ; f2|]);;
Then you will get an graph like the one shown in the following picture:
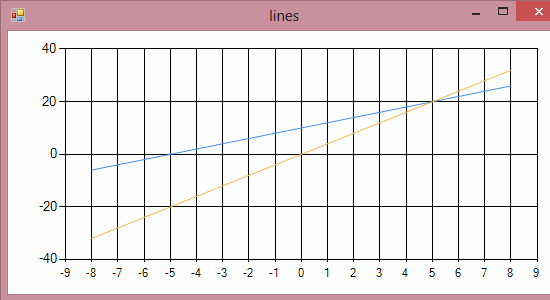
(F# Interactive WinForms Data Visualization Plot)
The picture demonstrates an intersection at (5, 20). This is the same location you would get if you solved the two previously equations manually.
You should note that the plotFunctions helper function does not limit you to two functions. Because it takes a variable number of args, you can pass in several functions. In fact, you don't even have to declare the functions. You can pass in anonymous functions. For example you can try something like this if you want:
> plotFunctions (0.0, 6.0,
-    [|(fun x -> x + 3.0) ; (fun x-> 4.0) ; (fun x -> x * x) |]);;
The above command plots part of a parabola and two lines on the same graph. Don't be concerned with the unusual x -> x type syntax. That's just a requirement of the anonymous functions. You can simply read the above command as plot:
- y = x + 3
- y = 4 and
- y = x2
Now that we have went through this effort and seen a small taste of what F# can do, I really need to point out that Tomas Petricek explained to me in [4] that there are already F# Sharp charting bindings available here: https://github.com/fsharp/FSharp.Chart
If I read Mr. Petricek's post correctly, the library appears to offer a clean, easy syntax. I suspect that if you are willing to download the library, it should also offer much more flexibility that the HuggardPlot method that I proposed. Also, the FSharp.Chart project on GitHub appears to have been started by the man himself Don Syme.
Of course, I'm not as sharp as Syme, Petricek and many other Microsoft
buffs, so I will leave you will one final example of how F# really shines
in Data Visualization. If you are into the
Force, then you should
really watch this cool example by
Luke on how FSharp Interactive can
easily create DirectX animations:
http://channel9.msdn.com/Blogs/Dan/C9-Bytes-Data-Visualization-and-FSharp-with-Luke-Hoban
(I'm unable to verify but some of this work may be based on stuff
that was done previously by Don Syme)
I hope that you can see from a combination of my blog post and Luke's demo, that FSharp Interactive has potential for *all* kinds of people. From 10/11 year olds to engineers/physicists. In fact, I have already briefly exposed my 7 year old to *basic* F#, but I am a bit disappointed that she hasn't figured out the classic recursive factorial [5] problem yet.
Bibliography
1. Conversion Factors Appendix.James Shippman, Jerry Wilson and Charles Higgins.
An Introduction to Physical Science.
Boston : Brooks/Cole,
Cengage Learning, 2013.
ISBN-13: 978-1-133-10909-9
2. Syme, Don.
F# Interactive Tips and Tricks: Visualizing Data in a Grid
MSDN Blogs: Don Syme's WebLog on F# and Related Topics.
[Online] Jan 8, 2010.
[Cited: APR 27, 2013.]
http://blogs.msdn.com/b/dsyme/archive/2010/01/08/f-interactive-tips-and-tricks-visualizing-data-in-a-grid.aspx
3. Hugard, James et all.
How do I plot a data series in F#?
StackOverflow. [Online] 18 JUN, 2010.
[Cited: MAY 27, 2013.]
http://stackoverflow.com/questions/3276357/how-do-i-plot-a-data-series-in-f.
4. Petricek, Tomas et all.
F# Interactive Pass ParamArray of Functions
StackOverflow. [Online] 27 MAY, 2013.
[Cited: MAY 28, 2013.]
http://stackoverflow.com/questions/16783196/f-interactive-pass-paramarray-of-functions
5. Various.
Recursion (computer science)
Wikipedia. [Online] MAY 27, 2013.
[Cited: MAY 28, 2013.]
http://en.wikipedia.org/wiki/Recursion_(computer_science)#Factorial
©2013 - Shawn Eary
This post contains material from StackOverflow that is licensed
under the Creative Commons license. That material continues to be licensed
via Creative Commons license. All other content that is specific to the poster
(Shawn Eary) is licensed under the
Free Christian Document License (FCDL)